


Of interest to us at Counterpoint is evolving research on investment anomalies, or challenges to market efficiency.We regularly publish new research summaries on the Perspectives page at the website of our affiliated advisor, Counterpoint Mutual Funds.
The following charts track historical relative performance characteristics of models driven by securities that score highest (top decile) and lowest (bottom decile) relative to the US stock market with respect to the given anomalies, mirroring the findings of the linked academic papers.
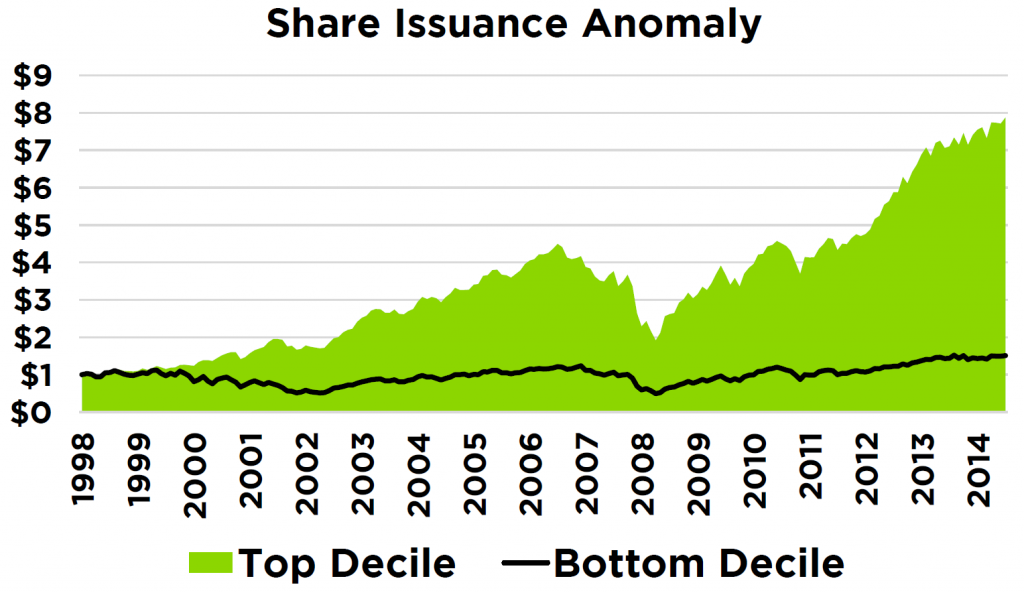
The Share Issuance anomaly demonstrates that companies which have recently issued additional shares tend to underperform relative to companies that have not. A likely explanation: Executives at share-issuing companies know more about negative prospects than outside investors.
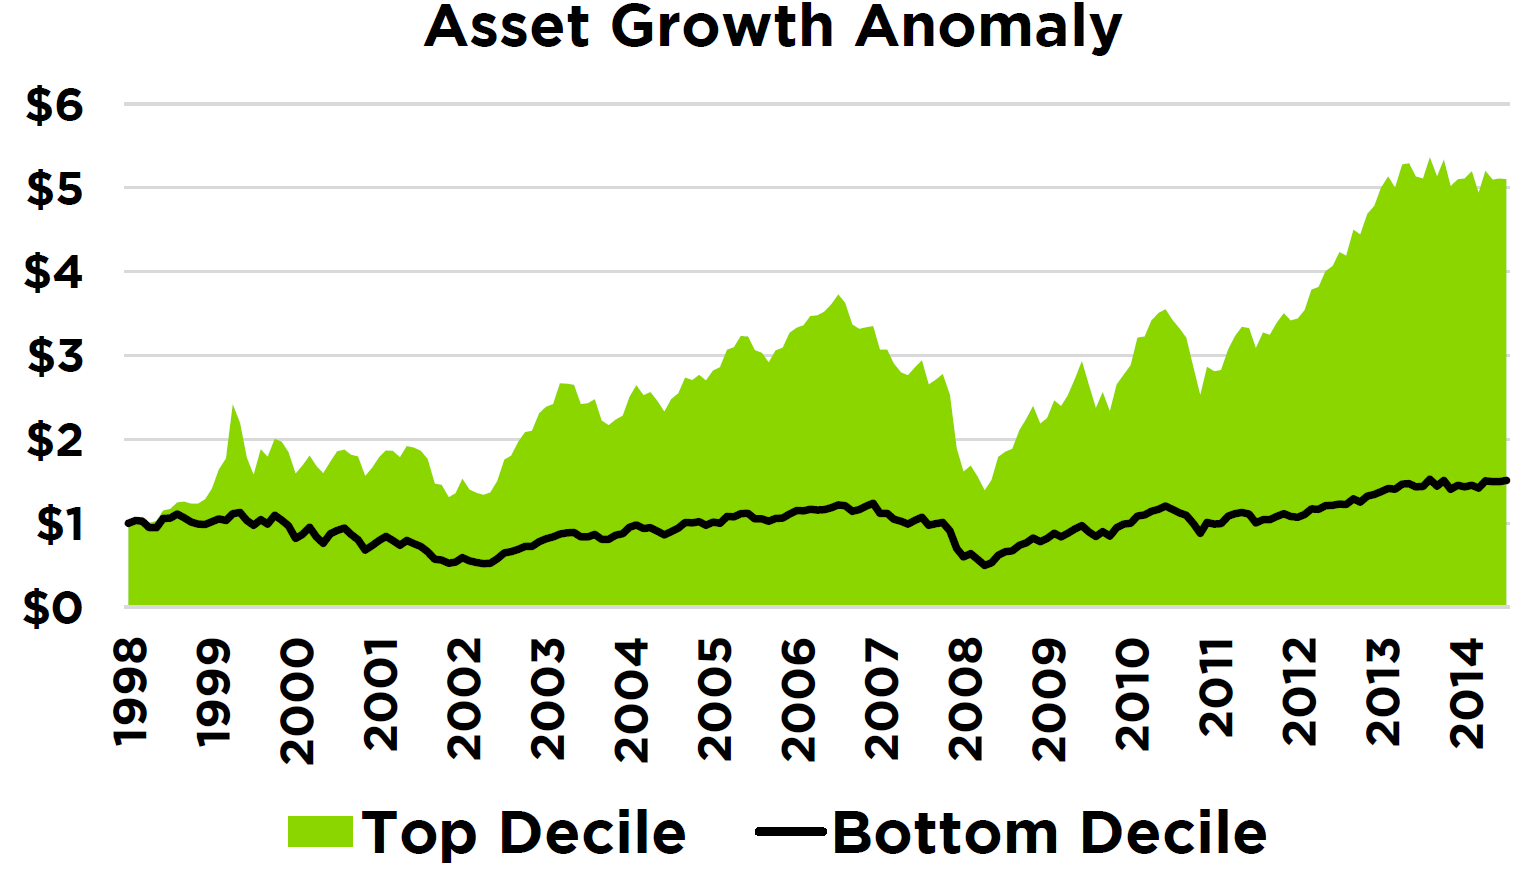
The Asset Growth anomaly depicts shares of companies whom are the most aggressive capital spenders have poorer average stock performance (bottom decile) versus shares of companies who are more conservative investors (top decile). This is evidence that shareholders systematically overestimate the investment decision capabilities of company management.
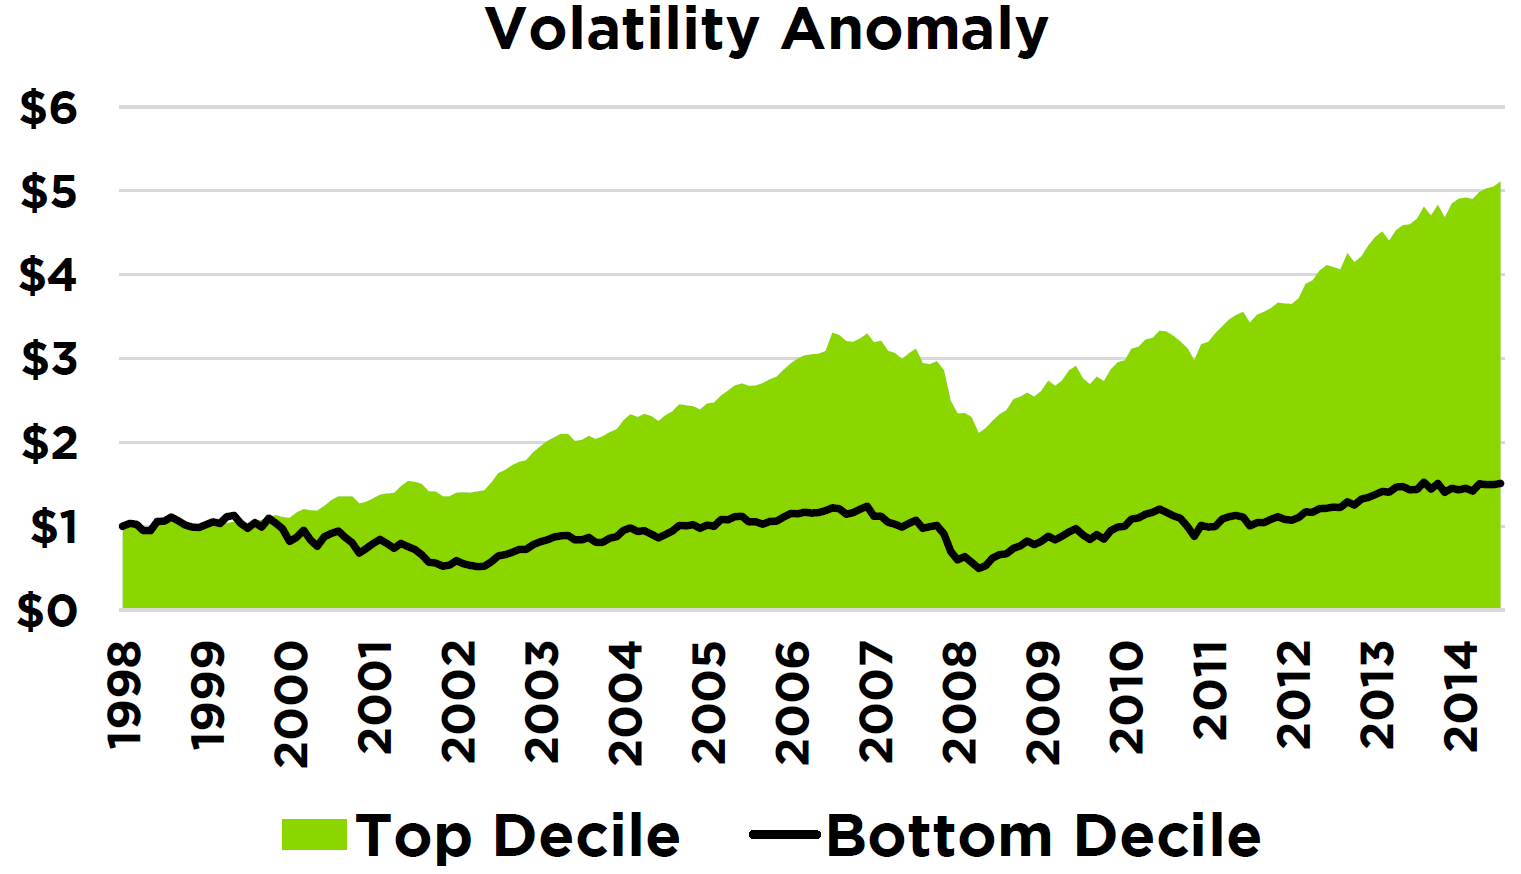
The Volatility anomaly shows that shares of companies with low standard deviations in stock price tend to outperform shares of companies with higher relative standard deviations. Investors often are willing to overpay for volatile and distressed companies with hopes of lottery ticket-like payoffs.
DISCLOSURES
The Share Issuance Anomaly figure above represents the total compounded return on $1 invested initially in December of 1998 in a monthly rebalanced even-weighted portfolio without transaction costs of U.S. stocks deciled by total share issuance estimates. Share issuance is defined as the annual percentage of new shares issued over the prior fiscal year. Top Decile represents the 10% of stocks with the lowest share issuance while Bottom Decile represents the 10% of stocks with the highest share issuance.
The Asset Growth Anomaly figure above represents the total compounded return on $1 invested initially in December of 1998 in a monthly rebalanced even-weighted portfolio without transaction costs of U.S. stocks deciled by asset growth. Asset Growth is defined as the annual percentage change in book value of assets in the prior fiscal year. Top Decile represents the top 10% of stocks with the lowest asset growth while Bottom Decile represents the 10% of stocks with highest asset growth.
The Volatility Anomaly figure above represents the total compounded return on $1 invested initially in December of 1998 in a monthly rebalanced even-weighted portfolio without transaction costs of U.S. stocks deciled by total standard deviation estimates. Volatility is defined as the trailing 12 month standard deviation. Top Decile represents the 10% of stocks with the least total standard deviation while Bottom Decile represents the 10% of stocks with the highest level of standard deviation.
These figures do not represent SMA strategy performance at Counterpoint Asset Management and are for illustrative purposes only. Past performance is no guarantee of future results. All raw return and accounting data obtained from CRSP.